See how your community is growing
Review membership, earnings, engagement and traffic together, then plan around the hours when your community is most active.
- Creator Platform

One place to review community performance
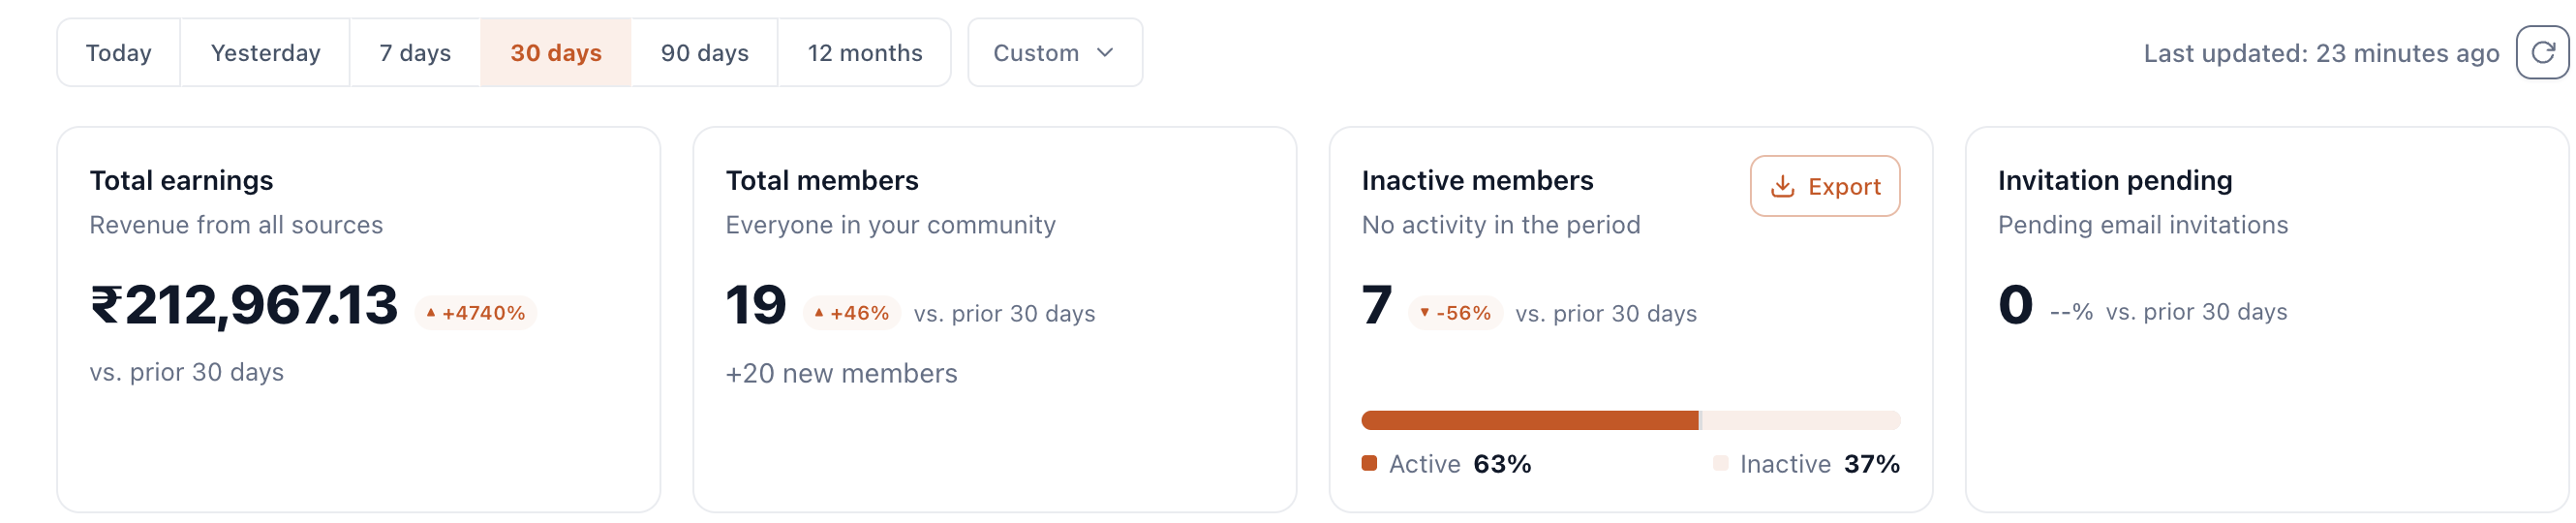
Community owners and admins can open Settings → Analytics to review membership, earnings and engagement across a shared date range. The dashboard starts with the last 30 days and supports preset or custom ranges.
Headline cards show net community earnings after refunds and chargebacks, current active membership, members without tracked activity during the period, and outstanding invitations. New joins appear separately from the current member count. Comparisons use the previous period of the same length; a zero previous value produces N/A.
See where visits come from and when members participate
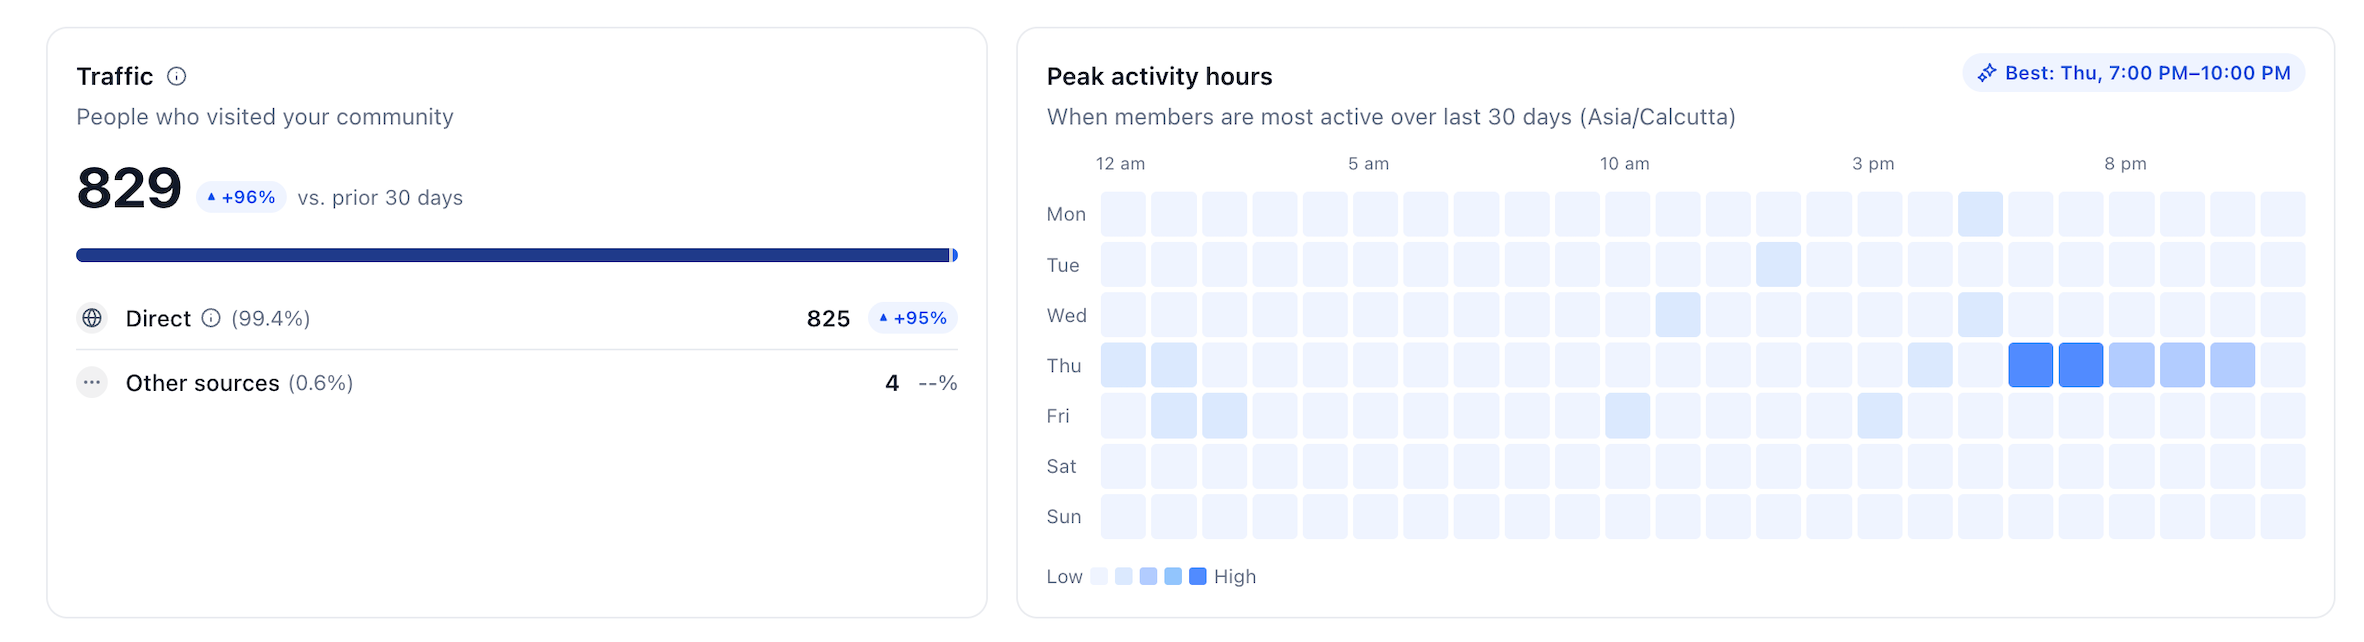
Traffic sources show how people reach the community, with the largest named sources shown separately and smaller sources grouped under Other. Page-view capture is rolling out, so traffic builds as new visits are recorded. Historical traffic is not backfilled.
A day-by-hour heatmap shows activity in the community timezone. Use it as a guide when choosing a time for posts, events or live sessions. The times shown in a demonstration are specific to that community.
Follow engagement and prepare a follow-up
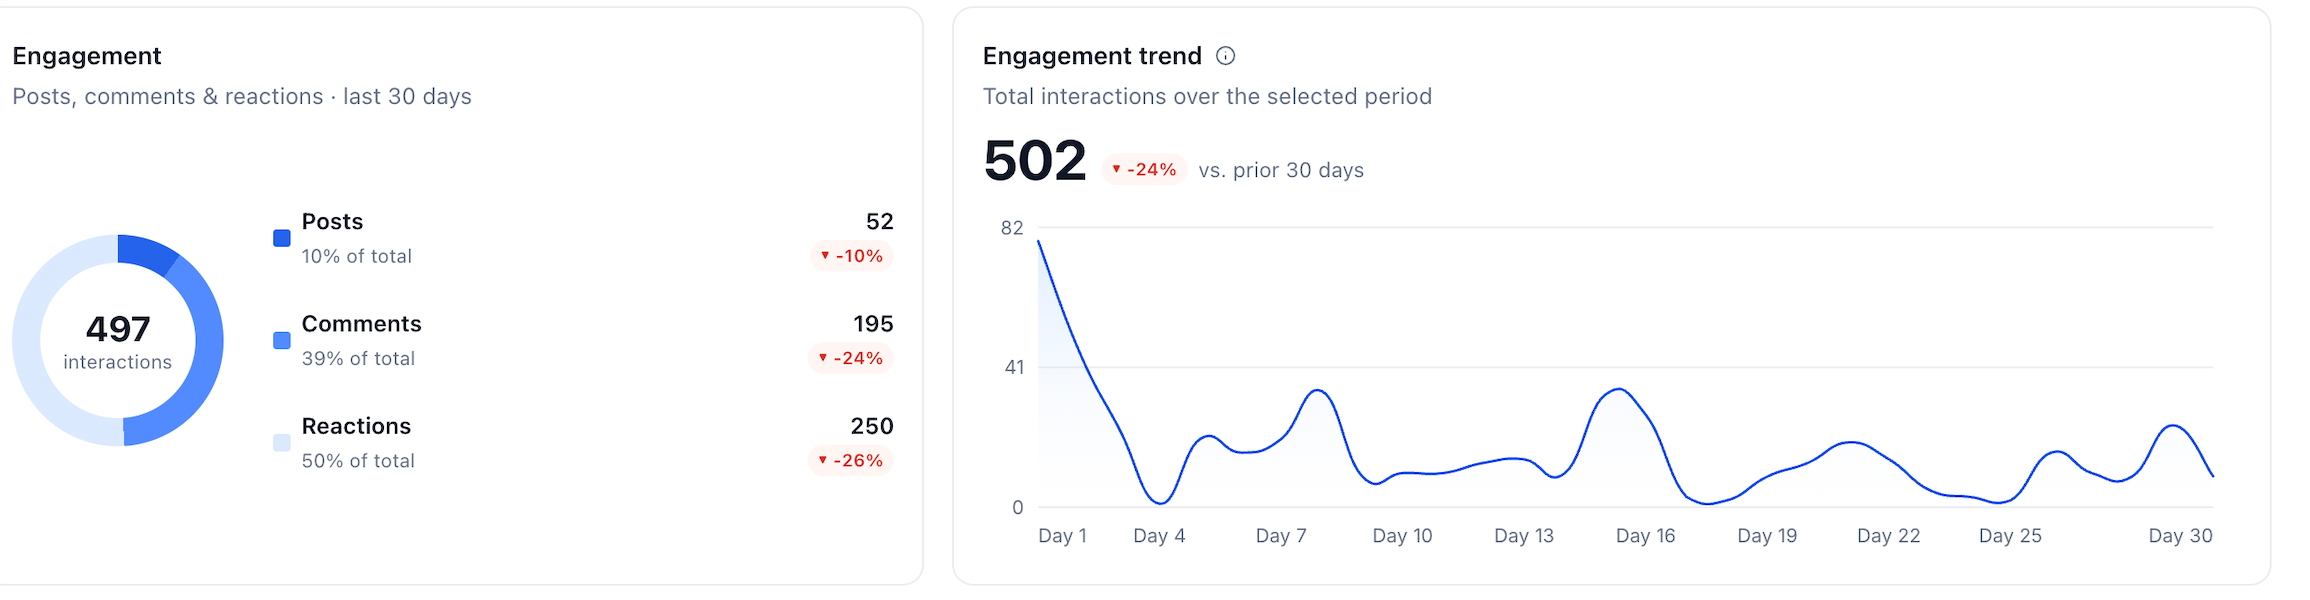
Review posts, comments and reactions alongside the engagement trend. The overall engagement measure also includes poll votes and event RSVPs.
Owners and admins can export the inactive-member list as a CSV for their own follow-up process. Exporting a list does not send a message. Earnings use the sub-account currency.